Arlington is denser and more diverse than it was 10 years ago, according to recently-released 2020 Census data.

The population living within the county’s 26 square miles now sits at 238,643 — a 14.9% increase over 2010, when 207,627 people called Arlington home. That outpaced the rate of population growth for Virginia and the U.S. as a whole, at 7.9% and 7.4%, respectively.

Meanwhile, the county is more diverse today than it was a decade ago: Arlington’s white population declined by 3,677 people, while the number of Hispanic or Latino, Black, Asian, multiracial and indigenous people all increased. That decade-long change reflects a similar change occurring across the nation that was the subject of a flurry of reports last week.

Now that the data is in, county staff will be reviewing the numbers to see what they mean for Arlington, said Bryna Helfer, the assistant county manager for communications and public engagement. Census data helps the county plan for future needs and services, such as emergency services, schools and transportation, while the federal government uses the demographic information to apportion funding to localities.

“Arlington’s team of demographers in Community Planning and Housing Development will be taking time over the coming weeks and months to learn more about the 2020 Census Data and what it means for Arlington,” Helfer said. “We want to thank the entire community for their participation in the 2020 Census.”

Arlington is the eighth most-populous jurisdiction within the Commonwealth, but among counties in Northern Virginia, Arlington has the smallest population, behind Fairfax, Prince William and Loudoun counties. It is growing faster than Fairfax County and D.C. but slower than Loudoun and Prince William counties.

Much of Arlington’s growth appears to be concentrated in Metro corridors — part of the county’s goal of “smart growth” around transit areas.

One census tract within Ballston appears to have the highest density not only in Arlington, but in the D.C. area, attaining a population density similar to parts of New York City. It comes in at 96,758 people per square mile, comparable to the Upper West Side of Manhattan.

Overall, Arlington has a population of about 9,180 people per square mile.

As the population grew, 13,000 housing units came online in the county. Despite the housing growth, only a handful of census tracts across the county reported fewer than 90% of their housing units as occupied. On average, Arlington has a housing unit vacancy rate of 7.7%.

While that is lower than the state’s vacancy rate of 8.2%, Arlington has a higher vacancy rate than its neighbors — Fairfax, Loudoun and Prince William counties — which have rates between 3 and 3.8%.

Like many other parts of the nation, the snapshot of Arlington in 2020 was more diverse than 10 years ago. It dropped from being 71.7% white in 2010 to being 61% white in 2020.

The most dramatic increase was in the number of people who identify as multiracial: This population group increased by 18,101 people, or by 233%, and now comprises 10.8% of the population. Following behind them, Asians also leaped in representation, due to a 7,512-person increase. Asians now comprise 11.5% of the population, up from 9.6% in 2010.

Although the Black population increased by 3,243 people (18.4%), Black residents still comprise roughly the same percentage of the population, from 8.5% in 2010 to 8.7% in 2020.
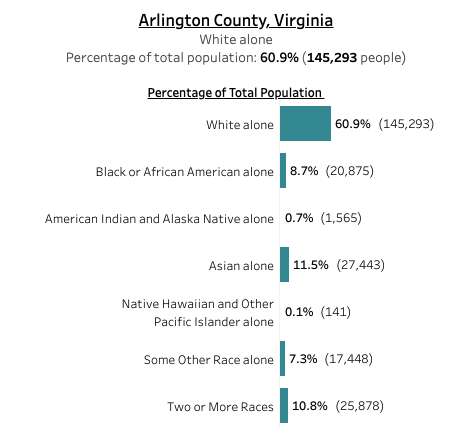
Race in Arlington County per the 2020 census data (via US Census)

The Hispanic or Latino population also made some gains —  an increase of 5,980 people, or 0.6 percentage points.
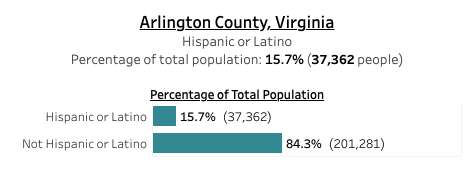
Hispanic or Latino percentage of Arlington’s population (via US Census)

(more…)


Amid a rise in coronavirus cases, community leaders and the Arlington County Public Health Division are continuing to find ways to target particular demographics for which more outreach is needed.

So far, 70% of the adult population in Arlington and 61.8% of the county’s entire population has at last one dose of the COVID-19 vaccine, excluding federal doses, according to the Virginia Dept. of Health dashboard. Nearly 64% of the adult population and 56% of the overall population is fully vaccinated. But these percentages start to vary more when broken down by age group, race and ethnicity.

For example, vaccination rates differ by nearly 20 percentage points between Asian or Pacific Islander and Latino Arlington residents, whose rates surpass 70%, and Black and white residents, whose rates hover around 56-58%. Meanwhile, the age group with the lowest vaccination rate is 25- to 34-year-olds, 59% of whom are vaccinated, while the highest rate is among 16-17 year olds, of whom 96% are vaccinated, according to VDH data.

Some disparities, particularly in sub-groups with larger population counts, can be tied demographic factors. But some data points, especially for smaller population sub-sets, may be tied to estimation errors, according to the Virginia Dept. of Health.

According to VDH spokeswoman Cindy Clayton, certain demographics with smaller population counts can lead to these high percentages.

“This is likely due to estimation error in the population data, especially when the denominator is a small group, like 16-17 year-olds or Native Americans,” she said. (More than 106% of local Native Americans appear to be vaccinated, according to the state dashboard).

The state health department uses census data compiled and modeled by the Centers for Disease Control and Prevention to calculate vaccine percentages at the local level.

“Although efforts were made to use the best available data and methods to produce the bridged estimates, the modeling process introduces error into the estimates,” according to the CDC’s explanation of the demographic data it stores.

Vaccination rates by race and ethnicity (via Virginia Dept. of Health)
Vaccination rates by age (via Virginia Dept. of Health)

Although some numbers have to be taken with a grain of salt, at this point, both community leaders and the county are now tailoring their vaccine outreach efforts toward “myth-busting” and focusing on particular subgroups.

“Arlington continues to encourage everyone 12 and older in Arlington to get vaccinated to protect themselves, their loved ones and their communities,” said Ryan Hudson, a spokesman for the Arlington County Public Health Division. “Vaccines are free for everyone, and offer the best form of protection against COVID-19.”

The county operates two vaccine clinics, open seven days a week, to accommodate everyone in the community, he said. The division also conducts “field missions” with targeted vaccine clinics at strategic community locations, including libraries.

“Additionally, the County continues to explore creative initiatives (the previously-covered coasters and cocktail napkins; vaccine QR codes at the recent Bands & Brews on the Boulevard; outreach by the Complete Vaccination Committee; etc.),” Hudson wrote.

More recently, the division’s communications have focused on “myth-busting,” which he says is “in an effort to dispel much of the misinformation that exists. Some examples he said include the impact of the vaccine on puberty, fertility, pregnancy and breast-feeding, as well as concern about corner-cutting due to how quickly the vaccine was developed.”

(more…)


County officials are trying to drum up participation in the next U.S. Census — a year before the feds start surveying and counting.

Arlington has joined other neighboring jurisdictions in creating a group called “Complete Count Committee” tasked with convincing residents to fill out the 2020 Census form when it arrives next April.

Wanda Pierce, a Nauck resident who co-chairs of the committee, said the group is “representative of all different types of organizations, ethnicities, religions, everyone across Arlington, because to reach a lot of the hard-to-count populations, we have to have those members on the committee,” per a press release.

“The U.S. Census Bureau cannot conduct the 2020 Census alone,” the website for the committee reads.

County Board Chair Christian Dorsey also signed a proclamation calling on “the Arlington community to rise up as leaders and partners in this effort to reach 100% participation in the 2020 Census campaign.”

“It’s not enough to want to count everybody,” said County Manager Mark Schwartz at the event. “We’re going to have to go out and tell people that we want to work with them to make sure they are counted.”

Each member of the committee is tasked with recruiting at least 1,000 Arlington residents to take the annual survey, per the committee’s website.

Previously, Principal Planner and co-director of the Arlington County Census 2020 campaign Elizabeth Hardy spoke at a March meeting with the Metropolitan Washington Council of Governments where she noted the county began 2020 census preparations in 2018.

“This time I feel like every resident is in a hard-to-count community,” said Hardy, who worked on the awareness campaign for the 2010 census.

She said there “were a lot of lessons learned” from the 2010 campaign, and that this time around the county planned to share more resources with neighboring jurisdictions.

The census is administered once every ten years by the federal Census Bureau.

Next year’s Census has drawn controversy after Commerce Secretary Wilbur Ross’s decision to collect information about respondents’ about the citizenship status, a largely unprecedented move that’s been criticized by civil rights advocates and defended by President Trump.

The Supreme Court is expected to make a ruling on the citizenship question on April 23.

The most recent Census estimate of Arlington’s population — made in intervening years between official Census counts — was 234,965 as of July 1, 2017. That showed Arlington’s population has continued to grow, from 230,050 in 2016, 226,908 in 2014 and 207,627 from the last Census count in 2010.

Every level of government studies the population data gleaned to make funding decisions. The number of people counted also determines how many House of Representative seats each state is awarded.

Image via U.S. Census Bureau


What does Arlington look like? The Census Bureau recently released the results of its 2009 American Community Survey, which provides a one-year estimate of various population trends.

According to the data, Arlington’s population is 217,483 and growing quickly: up 6 percent in just the past two years.

Arlington is slightly more male than female: 51 percent to 49 percent.

As mentioned before, the school-aged population in Arlington is relatively low. The percentage of the population that’s under the age of 18 is 16.4 percent, compared to the national average of 24.3 percent.

The married population is about 10 percent below the national average. Only 39.7 percent of women are married, while 41.5 percent of men are married. Among men, 49.2 percent have never married, compared to 44.2 percent of women.

Arlington’s population is 17.1 percent Hispanic, 7.7 percent black, 7.9 percent Asian, and 63.6 percent non-Hispanic white. Recent racial trends are all within the margin of error — too slight to accurately measure.

The percentage of people who said they were unemployed more than doubled between 2007 and 2009: 2.5 percent compared to 5.8 percent.

Asked about their commute to work, 53.8 percent of Arlingtonians said they drive alone, 8.2 percent said they carpooled, 26.0 percent took public transportation, 5.4 percent walked, 2.1 percent took “other means” (perhaps biking) and 3.5 percent worked from home. The mean commute time was 25 minutes.

Arlington is affluent. Just over 47 percent of the population is in a household that earns more than $100,000 per year. Nearly 15 percent earn more than $200,000. The mean household income is $121,820.

To see the data for yourself, click here.

Flickr pool photo by Amber Wilkie Photography.


At a community chat hosted by the African American Leadership Council of Arlington Wednesday night, Arlington Public Schools Superintendent Dr. Pat Murphy was asked about the changing demographics of the school population.

According to Dr. Murphy, school administrators have observed the following trends:

  • An increase in Hispanic students
  • A stablization in the number of black students
  • A decrease in white and Asian students

A relatively low 15 percent of Arlington residents have school-aged children, school officials said. Roughly one quarter of the school-aged population attends private schools.